Data Flow Diagram (DFD)
Data Flow Diagram (DFD) shows a flow of data in a process or a system. It also depicts inputs and outputs.
What is Data Flow Diagram?
A data flow diagram (known by acronym DFD) is a diagram notation used in software engineering. It depicts the flow of data or information within a system (usually an information system). It focuses exclusively on information transfer between the parts of a system and it purposely omits any control flows, loops, or processing rules.
Data Flow Diagram Symbols
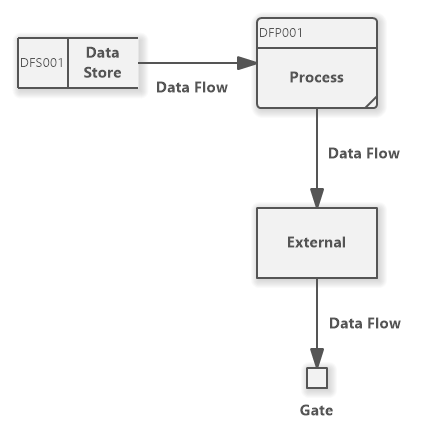
A data flow diagram is made up from these elements:
- Flow - (also known as Data Flow) a connector that shows data or information transfer between two entities in the modeled system. It also shows the direction of the information flow.
- Process - is a part of a modeled system that transforms inputs to outputs.
- Data Store (also known as Warehouse) - represents any form of data storage - e.g. databases, files, data stores.
- External (also known as Terminator) - depicts an entity that communicates with the system. It may be human operator, group of people, department, or organization.
DFD Notations
There are two notations of data flow diagrams:
- Yourdon/DeMarco
- Gane & Sarson

Data Flow Diagram (Yourdon/DeMarco)
Data Flow Diagram (Gane&Sarson Notation)
How to Draw a Data Flow Diagram?
You can create a new data flow diagram in multiple ways:
- Click on a Plus button in the tab switch bar, navigate to Other group and click on the Data Flow Diagram or Data Flow Diagram (Gane & Sarson) item
- Press CTRL+SHIFT+D, choose Data Flow Diagram or Data Flow Diagram (Gane & Sarson) from the Other group, enter the name, and click on the OK button.
- Switch to Project tab in the ribbon and click on the Data Flow Diagram or Data Flow Diagram (Gane & Sarson) item in the Content gallery.
- Open Project sidebar, right-click on a project (or a folder) node, and in the Add Diagram submenu, choose Data Flow Diagram or Data Flow Diagram (Gane & Sarson) from the Other submenu.
How to Draw DFD Elements?
How to Draw a DFD Process?
- Click on the Process button in the Data Flow Diagram group in the toolbox.
- Specify the bounds of the new process by dragging on the diagram canvas.
- If you want to add a process with the default size, just click on a diagram canvas and the process symbol will be inserted to the specified position. You can also drag the Process button from the toolbox and drop it to the desired position on the diagram.
- If you want to insert multiple processes in a row, double click (or click twice) on the Process button in the toolbox and draw so many process elements as you want in the diagram editor. If you do not want to add any more elements, press the ESC key or click to the Selection tool button.
How to Draw a DFD Data Store?
- Click on the Data Store button in the Data Flow Diagram group in the toolbox.
- Specify the bounds of the new data store by dragging on the diagram canvas.
- If you want to add a data store with the default size, just click on a diagram canvas and the data store symbol will be inserted to the specified position. You can also drag the Data Store button from the toolbox and drop it to the desired position on the diagram.
- If you want to insert multiple data stores in a row, double click (or click twice) on the Data Store button in the toolbox and draw so many data store elements as you want in the diagram editor. If you do not want to add any more elements, press the ESC key or click to the Selection tool button.
How to Draw a DFD External?
- Click on the External button in the Data Flow Diagram group in the toolbox.
- Specify the bounds of the new external by dragging on the diagram canvas.
- If you want to add an external with the default size, just click on a diagram canvas and the external symbol will be inserted to the specified position. You can also drag the External button from the toolbox and drop it to the desired position on the diagram.
- If you want to insert multiple external entities in a row, double click (or click twice) on the External button in the toolbox and draw so many external elements as you want in the diagram editor. If you do not want to add any other elements, press the ESC key or click to the Selection tool button.
How to Draw a DFD Flow?
- Click on the Flow button in the Data Flow Diagram group in the toolbox.
- Drag from an element (e.g. Process) to another element (e.g. Data Store). The flow shows the direction of data transfer between the two entities.
- Another way you can insert a flow between two entities is to click on the Flow button in the toolbox and drag it in between the desired entities (e.g. Process and Data Store). The diagram editor shows you which two elements will be connected when you release the button.
- If you want to insert multiple flows in a row, double click (or click twice) on the Flow button in the toolbox and draw the desired number of flows in the diagram editor.
Data Flow Diagram Examples
DFD Editor
If you are new here, you can continue with downloading Software Ideas Modeler, which provides data flow diagram editor:
Anonymous 16 March 2023 11:56:45
Thanks